In my experience, a large percentage of blue screens are the result of some poorly-tested or incompatible third-party device drivers. For the desktop crowd, a round up of the usual suspects includes scanner, printer, and video drivers. On the server end of things, the most likely culprits are usually backup/continuous data protection filter drivers or printer drivers.
All standard troubleshooting questions apply in either case:
- Has any new hardware been installed?
- Has any software recently been installed (either new applications or patches)?
- Have any existing device drivers been updated?
- Can you reproduce the conditions that cause the blue screen (for example, under heavy load conditions or during a backup window)
Take this case. I recently received a dump file from a server that had crashed and recovered overnight. To analyze the dump file, head on over to the microsoft.com site and get the appropriate debugging tools for your platform (x86 or x64/ia64).
In my case, I needed the 32-bit debug package. I downloaded and installed it, and then ran C:\Program Files\Debugging Tools for Windows (x86)\windbg.exe.
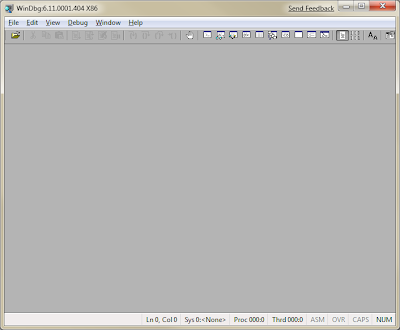
Before we can make any progress, we should grab the Windows symbols, which will allow the debugger to go through the crash dump and identify components.
Make a directory on your local computer, such as C:\Symbols. From inside WinDbg, go to File > Symbol File Path.
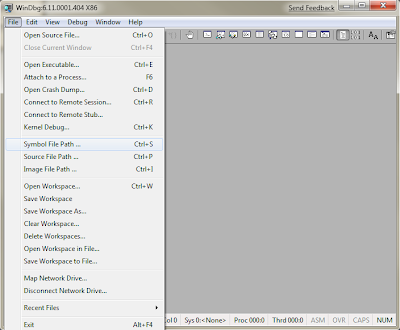
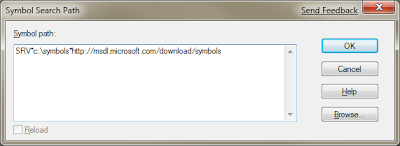
In the dialog box, type in
SRV*c:\symbols*http://msdl.microsoft.com/download/symbols
and click OK. This will instruct WinDbg to contact the Microsoft symbols server and download the parts that you need and store them in C:\symbols.
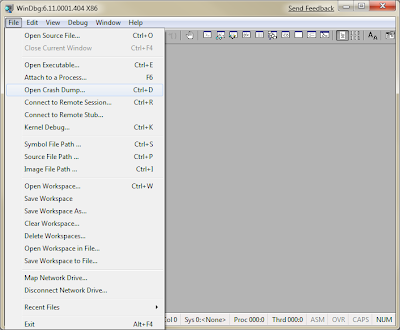
Now that the symbols are configured, click File > Open Crash Dump.
Browse to your memory dump file, and select it. WinDbg will process it, and should return something like this:
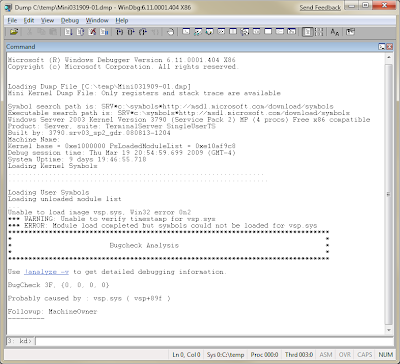
At this stage, WinDbg has identified vsp.sys as a likely source of the problem. Type !analyze -v in the text box at the bottom and hit enter.
WinDbg will process a bit more and return some (hopefully) useful information.
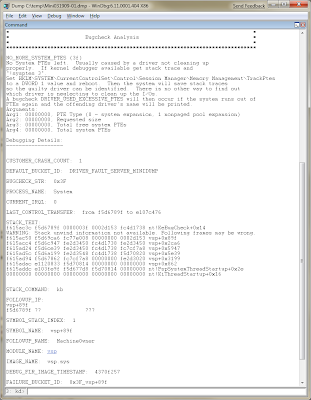
The key area to look at is the "DEFAULT_BUCKET_ID," which, in this case, says "DRIVER_FAULT_SERVER_MINIDUMP." Browsing through the dump file, you can see that the system ran out of PTEs and subsequently crashed.
Having worked with NetBackup for a number of years, I recognized vsp.sys immediately as part of NetBackup. However, if you want to try to figure out more from the dump file, typing the command lmv will list the loaded modules. After it's done listing the images, press Control-F to and enter the driver that was listed as faulting.
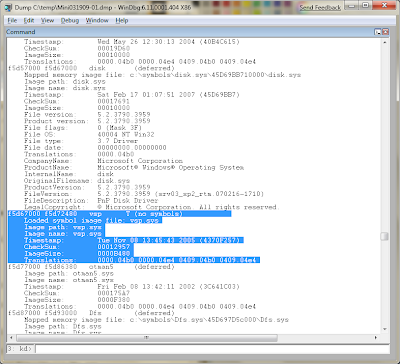
Unfortunately, the dump file didn't have the full path to the loaded driver, so we've hit a little bit of a wall.
In this instance, the faulty driver (vsp.sys) is part of the Advanced Open File option for the Veritas NetBackup client. We upgraded the NetBackup agent to the latest version and all is well again.
Good luck!
No comments:
Post a Comment